
Discover the eight signs a suburb’s property prices are set to soar and get in first.
With over 350,000 properties listed in 15,000 plus suburbs in Australia, it’s not surprising most investors feel a little panicky when it’s time to decide where to invest next. It’s not the kind of decision you want to make on a whim.
Fortunately, there are eight factual signs that a suburb’s property prices are set to soar … so you can pick a winning investment without listening to biased advice or sometimes sensationalistic media headlines.
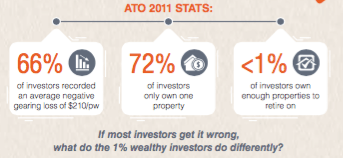
Remember: Capital growth is everything. Yes, rents pay the mortgage, but it’s equity that allows you to buy more properties without relying on your ability to scrimp and save for a deposit. Equity increases with capital growth and so do your opportunities to buy the 6+ properties the ATO says you need to replace your working income with passive rental income.
How to buy before prices surge
If you are time poor or lack the confidence and experience to invest like an investment superstar you have some choices:
- You can pay an expert to help you (but they sometimes have their own biases about where to invest).
- You can spend your weekends trawling the internet and analysing vast volumes of property data yourself.
- You could subscribe to the property media and follow their hotspot tips.
- You could just do nothing.
Obviously, doing nothing has predictable results.
There is a much simpler way …
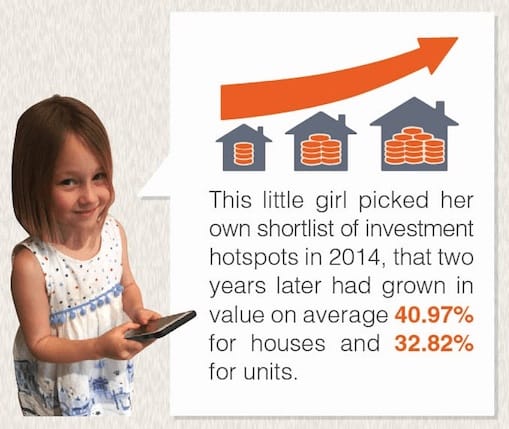
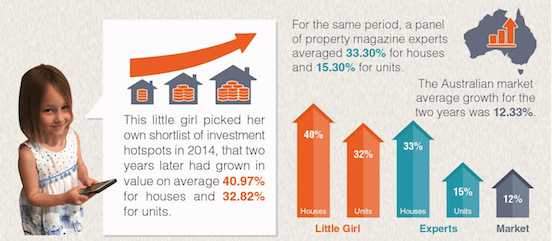
This little girl picked her own shortlist of investment hotspots in 2014, that two years later had grown in value on average 40.97% for houses and 32.82% for units. The Australian market on average had only grown 12.33% in the same two-year period (Jan 2014 – Jan 2016).
I’ll give you more details in a moment about how her predictions faired against the property experts, but first here’s how she picked her 2014 hotspots …
8 signs that prices are set to soar
So what were the eight factors that led to her suburbs smashing both the market average and the predictions of property experts for the same two-year period?
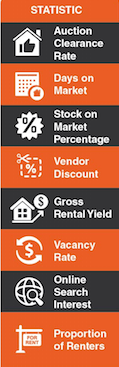
1 – The number of days on market that properties on her list took to sell were falling in comparison to most suburbs in Australia. Properties that sell quickly are in high demand suggesting demand exceeds supply and the area is sought-after.
2 – Seller discounting was dropping. Higher demand in her suburbs also means vendors didn’t have to discount much to secure a sale; a precursor to price increases.
3 – More properties selling at auction in her suburbs means buyer demand was growing compared to the number of properties available at auctions. Hot bidding means people are paying an emotional premium and pushing prices up.
4 – Fewer vacant rental properties in her suburbs meant tenants demand outstripped supply. As a result, rents increase improving the returns for landlords who then sell at higher prices to investors who are seeking good cash-flow positive rental investments (as apposed to capital growth).
5 – Sufficient renters compared to owner-occupiers to ensure low rental vacancy rates but also enough owner-occupiers to keep property valuations up. It’s well known that owner residents look after their properties better than landlords who do not live there. Picking suburbs with the optimum balance between available tenants and owner-occupiers is important.
6 – Gross rental yields were rising as the number of vacancies reduced, suggesting greater demand from tenants. As the area becomes more desirable, owner-occupiers begin to move in and buy the properties for a premium. They’re not interested in rental yield and buy on emotion.
7 – The number of properties for sale was reducing … or stock on market (for sale) as a percentage of all property in the area was tightening in most of her suburbs. As demand increases and stock levels reduce, then the heightened competition, for what is on sale, puts upward pressure on prices.
8 – The number of searches per property on the internet was increasing, indicating demand was strong for a limited number of properties.
The results
The big challenge for any investor is how to pick their own list of suburbs that, not only feature very well on all or most of the signs above, but fit their budget too.
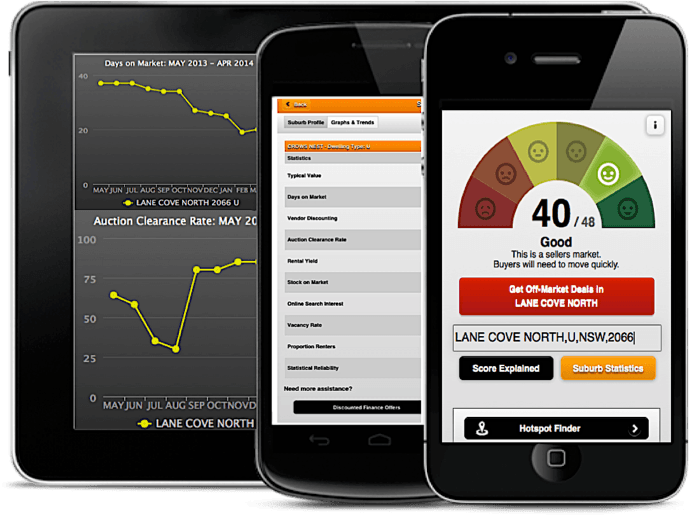
Each of these 8 demand or supply indicators of capital growth potential are freely available from multiple online data sources or through one source, our free research web app, Boomtown.
But is the data accurate and can you analyse it all to achieve the same results as this 6 year-old girl, my daughter, Olivia?
Beating the experts
As a regular on their expert panel, In December 2013, I was invited to submit my 2014 top suburb picks to Smart Property Investment Magazine for their ‘2014 Fast 50’ annual market forecast.
At the same time, my 6 year-old daughter picked her top 50 list using our free property research web app, Boomtown, at boomapp.com.au. Boomtown rank orders all suburbs by Demand to Supply Ratio (DSR) BoomScore™. Anyone can do it and it takes about 90 seconds using the Hotspot Finder feature.
How did little Olivia’s predictions fair?
We asked an independent data analytics company to audit both the average capital growth for my daughter’s top 50 and the SPI experts top 50 from January 2014 to January 2016.
Keep in mind, a lot of work went into the ‘experts’ list’.
Each expert would have done their own research. Looked at the data and the fundamentals and finally submitted them to SPI magazine. SPI magazine would have compiled the final list from the many options submitted by all the experts and finally created the ‘2014 Fast 50’ report.
I think this would have taken hundreds of hours and a huge amount of collective experience by the renowned panel of experts and the magazine staff.
But now let’s consider the results …
From January 2014 – January 2016, the national average capital growth was a very solid 12.33%.
Here’s how the SPI Top 50 experts’ predictions faired:
- SPI Top 50 Units - 15.30% growth
- SPI Top 50 Houses - 33.30% growth
And amazingly, here is how little Olivia’s Boomtown predictions did:
- Boomtown Top 50 Units - 32.82% growth
- Boomtown Top 50 Houses - 40.97% growth
As I said, we had this independently verified – it’s not our analysis proving our own data.
I must admit, we weren’t surprised by this result.
In 2014, we analysed the performance of all 15,000 suburbs between 2010 and 2013 when the market was in negative growth territory. That’s when the property market average growth for three years was -1.7%. Pretty dire, right? We then looked at our top 100 suburbs predictions at that time and analysed the subsequent capital growth of these 100 suburbs during the same three year period – they all averaged 11.85% (way above -1.7%) … and in a negative market. This result was also better than the experts then too. The annual top 100 suburbs picked by experts for Australian Property Investor magazine at the time, while much better than the market average, only grew by 7.3%.
The data does not lie … and Boomtown predictions continue to outperform the experts. And we scanned the entire market to produce these predictions in just 90 seconds. Like Olivia, I’d rather trust the facts.
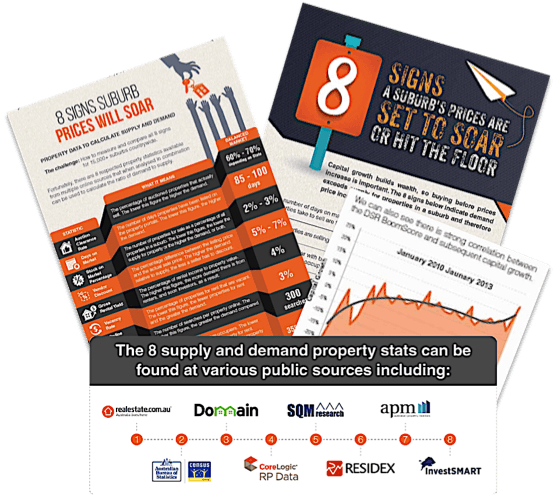
The 8 Indicators: Where to get the data and how to make sense of it
GET YOUR FREE INFOGRAPHIC
8 SIGNS A SUBURBS PRICES ARE SET TO SOAR OR HIT THE FLOOR
Each property stat can be a powerful indicator of a market’s health. But like all data, property data is also subject to anomalies and inaccuracies.
Yes, we are lucky in Australia, we have great property data available to us from a long list of online sources. The problem is the data quality can vary from source to source and from month to month. So which data is best at any given time?
To reduce the chance of making a bad purchase decision:
- never rely on one statistic
- never rely on one statistic from only one source
- always assess the statistics in combination
- always track the trends in the statistics over time.
Very few investors know where to find these statistics. Even fewer know how to bring them together for units and houses in over 15,000 suburbs …. that’s 30,000 micro property markets with their own supply and demand dynamics.
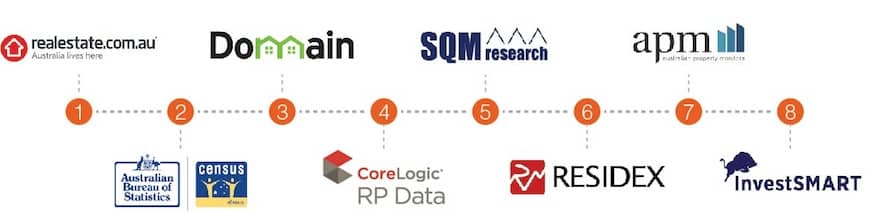
Pictured above are some of the sources of property stats for gauging supply and demand.
Assuming you now had all ‘8 signs that a suburb’s property prices are set to soar’ above, what are the ideal readings for each indicator? Few investors, and certainly not my 6 year-old girl, know what a good reading or benchmark for each statistic is.
Many find that interpreting the data is even more challenging.
If you want the answer to all of these questions and want to learn how to find your own investment hotspots using publicly available data, then you need our handy cheat-sheet which gives you a snapshot of:
GET YOUR FREE INFOGRAPHIC
8 SIGNS A SUBURBS PRICES ARE SET TO SOAR OR HIT THE FLOOR
- the 8 important property markets stats you need to understand
- the ideal score for each factor so you know how to assess them
- the individual data sources so you know where the detail comes from
- the free property research web app, Boomtown, which does all the work for you, accurately.
In my next blog post, I will show you how to access the very same tool my 6 year-old daughter used to generate her list of 50 hotspot suburbs that beat the experts and smashed the national average.
But more importantly, we’ll look at how you can generate your own list of potential investment hotspots depending on your strategy and budget. For example, if you wish to ‘buy-renovate-sell’ with a budget of $350,000, then you will change the settings from the very simple “show me the top 50 suburbs in the whole of Australia with the best capital growth potential” to “show me all suburbs where properties sell fast and sales price discounts are tightening”.
Knowing what data is available and how to customise the use of this data in an easy-to-use and tried and tested app will change how you invest in property forever. Gain back your weekends, remove the subjectivity and choose where you invest based on the cold hard stats. Say goodbye to panic and doubt. You’ll feel great afterwards. Excited even.
Check out our recent blogs in this series.
Want more regular insights and case studies...follow live projects...get tips and location reports ...and much more...then connect with us below.