Register your interest

  COMING SOON  | REGISTER NOW TO BE NOTIFIED  

Want to Know when and where to Buy property in the Next Boom?

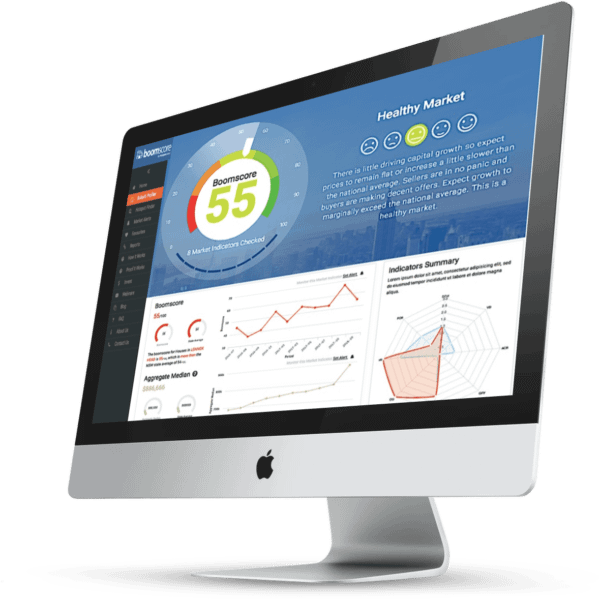
Be the first to know when the all new version of (10-year old) our Boomtown research platform is released to the market. The timing couldn't be better. Now you can quickly pick the best investment location for your budget and strategy... in only a few clicks. Our powerful data algorithms compare 15,000+ locations against 8 leading indicators of supply and demand for property in the area making it easy to pinpoint a handful of areas that are primed to boom soon...that's only 0.1% of suburbs to focus on. Save time and invest ahead of the pack before they push your property's price up.

WHICH INVESTOR ARE YOU?

Most Real Estate Investors Get it Wrong!

60%

2/3 of investors record an annual loss against rental income

71%

71% Of investors only
own one property

1%

Why do only 1% of investors  retire on rental income?

Almost 1.5m property investors in Australia get stuck on just one investment property. Over 60% are negatively geared costing over $10,000 per annum while hoping for some uncertain future capital growth. Estate agents, the developer, mortgage broker, bank: all get paid first before the poor investor hoping some future capital growth will compensate them for the risk and cashflow sacrifice each month.

ATO 2016-17 TAX YEAR STATS

CALCULATING SUPPLY & DEMAND

The 8 property market indicators that measure supply and demand so you can pick the very best locations using 'behind-the-scenes' hardcore data science and AI

These are the 8 supply-demand indicators Boomtown uses to calculate the ratio of demand to supply for all 15,000 suburbs - split further by units and houses. It's incredibly smart so you don't have to be :-)

1
DAYS ON MARKET
The number of days a property takes to sell after being listed. If it sell fast this is a good indication of demand.
2
AUCTION CLEARANCE RATE

The higher the percentage of properties that sell at auction the higher the demand.

3
STOCK ON MARKET%
The percentage of all properties in a suburb that are for sale giving a strong indication of supply.
4
GROSS RENTAL YIELD
The rental income as a percentage of property value. If this is high it can lead to price increases as potential buyers will value the higher rental income.
5
VENDOR DISCOUNTING
The average discount given by the seller compared to the original asking price. The lower the discount the more demand competing for property in the area.
6
VACANCY
RATE
The percentage of properties available for rent. When this is low, tenants compete which pushes rents up and subsequently prices too.
7
ONLINE SEARCH INTEREST
The number of searches for each property listed for sale in a suburb on the property portals. The more searches the more people showing interest and therefore the more demand for property. 
8
PROPORTION OF RENTERS
The lower the number of renters in the area the more demand there is relative to supply from incoming tenants. Also, more owner residents help keep values up as they look after properties better than landlords.

Our 10 year track record of beating property market expert predictions has been widely published. All we used was Boomtown

Your Investment Property Magazine featuring Boomscore

 Boomtown version 1 featured in Your Investment Property Magazine

One of our magazine's most popular data features.
Boomtown provides a handy way to identify the countries hottest suburbs without spending countless hours searching, sorting and analysing vast amounts of property information.

Your Investment Property Magazine
April 2012

HOW DOES IT WORK?

In only 4 minutes you can Find, Analyse, Monitor and Shortlist a handful of suburbs that simply stand out next to 15,000+ 

Now you can find the best locations depending on your budget and strategy (including renovate, cashflow, develop, discounted and more) using Hotspot Finder. If you're not ready to invest, or simply want to know the best time to buy or sell, then Market Alerts can help. Suburb Profiler gives you all facts behind each suburb including the trends in the data and how it stack up compared to state averages and other suburbs.

Suburb Profiler has all the data you need to make a quick decision

Suburb Profiler gives you all the data and charts to help you make a quick decision

SUBURB PROFILER Feature

Analyse all the key data behind a suburbs potential

It's easy to pick a location based on it's summary Boomscore. You already know a high boomscore  is linked to high relative demand but the data behind the summary boomscore is where things get a whole lot smarter.


HOTSPOT FINDER FEATURE

Pick the next high growth location before everyone else

Most people find it easier to stick with what they know and invest in their own location. Unfortunately, the vast majority of investment returns are found in a select few locations and before Boomscore, finding an area before it booms was mostly down to luck. No human can compete with machine learning and the shear processing power behind Boomscore.

sort hotspot locations in table

Find the best location for your budget in 4-clicks


Set alerts to changes in all the indicators and other important metrics

MARKET ALERTS FEATURE

Known when to buy or sell

The holy grail of property investing is knowing when to sell at the top of the market and when to buy before the area booms.
Set alerts to track changes in the most important indicators so that you buy at the bottom of the market cycle and sell closer to the peak.

'Time in the market' is important but 'timing the market' is now possible with intelligent data science.


boomscore finding emerging hotspot

data trends indicate emerging boom locations and areas to avoid

EXAMPLE BOOM LOCATION

Invest before prices rise

The holy grail of investing is to identify a hot suburb before everyone else finds out and drives prices up. Remember, the media 'tells' most investors where to invest. They are almost always wrong which is why the majority of investors also get it wrong when it comes to picking the all important location.

Boomtown shows you all the trends in each of the 8 market indicators and other relevant hotspot identifiers. 


NO GO ZONES

Know where to avoid

A 'no-go zone' suburb is a suburb where supply way exceeds demand and the trend in the data suggests it's unlikely to get better soon. Developer's pay huge commissions to offload properties in these oversupplied areas. Beware.


boomscore favourites feature
COMPARE the best

Too many options making you confused? Not ready to invest just yet?

We have this problem all the time here at BoomScore: too many great locations to choose from. No problem - shortlist and compare all the suburbs you like then strike when you're ready.


Boomscore spidermap

Spidermaps make it easy to visually pick a top suburb

VISUALISE DATA WITH SPIDERMAPS

A picture paints a thousand words.

Not everyone loves rows and rows of property data. It can be mind boggling and hard to assess for 'visual people' like our founder, Michael. Spidermaps make it easy to visually determine a suburbs potential.
>